By Paul Youldon, Senior Consultant, Lean Advisors Inc.
In the wake of Hurricane Sandy’s devastation in New York City in October 2012, food aid organisations were overwhelmed with demand. The existing processes were slow and inefficient even with the use of food trucks and volunteer efforts for food packaging.
Toyota stepped in by offering expertise from their seasoned Toyota Production System practitioners well-versed in Lean methodologies. These professionals transformed the food aid distribution approach by implementing Lean problem-solving techniques. The enhancement was substantial, as box packing times were slashed from 3 minutes to 11 seconds, without altering the workforce, space, or adding equipment.
This scenario highlights a key principle: view every obstacle or difficulty as an opportunity for improvement. Teams collaborated to focus on enhancements rather than fault-finding, overcoming numerous procedural barriers and organizational challenges.
Solving problems may be evident, yet it is common for businesses and organizations to value workarounds deployed by their top employees. They mistakenly often overlooking inherent problems, or accept these fixes as routine operation, not realizing they’re settling for inefficiency which escalates costs and frustrates clients and embeds ‘waste/non-value’ into standard procedures. It hampers advancement and raises the likelihood of unsuccessful outcomes.
Utilizing a simple methodology like the Fishbone methodology can elevate your organization’s quality, efficiency, and customer service to greater heights.
An esteemed tool for Lean problem resolution, the Fishbone Diagram was developed by Japanese engineer Ishikawa in the mid 1900s. Originally crafted for addressing quality discrepancies in production, this tool has become versatile for numerous troubleshooting in many environments both production and service. It’s also referred to as the Ishikawa or Cause and Effect Diagram and remains integral to practitioners of Lean, Six Sigma, and adherents to ISO Quality standards.
The Fishbone Diagram systematically charts all possible reasons for a setback, categorizing them to reveal linkages. As a methodical idea development aid, it promotes discussion. Comprehending causality is vital before implementing solutions, which underpins the purpose of the Fishbone Diagram.
Case Study/Example – Long-term Care Facility – Problem – Patient Fell
A) Analysis/Facts
- Time of fall: change of shift from days to evenings
- Location of fall: resident’s bathroom
- Witnesses: resident and aide
- Background: Resident was to be transferred with two staff members, or with one staff member using a sit-to-stand lift.
- Information from interviews:
- Anxious resident needing to use the bathroom urgently.
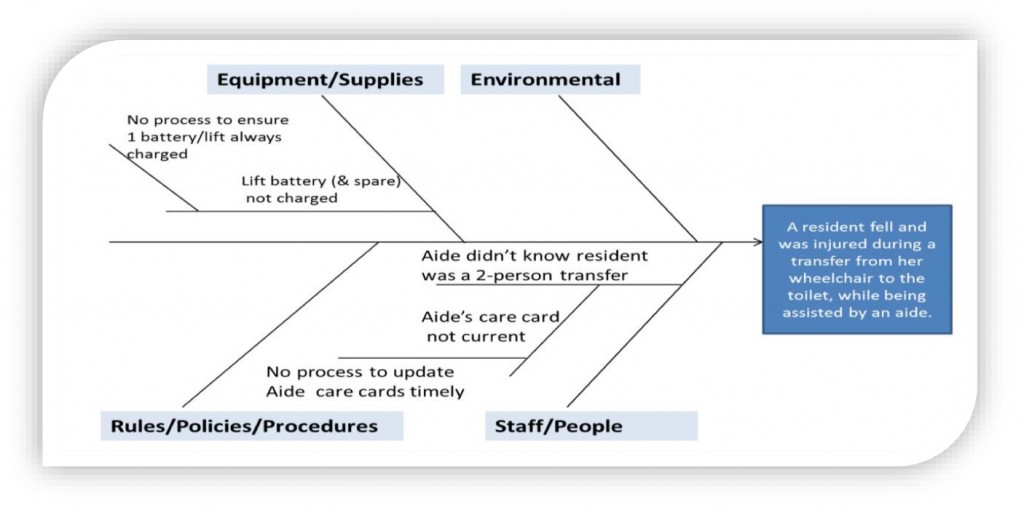
- The aide helped resident transfer from wheelchair to toilet with NO lift; resident fell and was injured.
- The aide stated she did not use the lift because the battery was being recharged, and there was no extra battery available.
- The aide stated she understood that the resident could be transferred with assist of one.
B) Utilized a Fishbone Diagram to Understand the Problem
Why use the Fishbone problem-solving tool
- Defines the issue
- Engages the staff
- Being a visual tool, it is easy to understand and analyze.
- Methodical and reduces personal bias.
- Identify the root cause of the problem.
- Locate bottlenecks in the process.
- Find ways to improve the process.
- Involves an in-depth discussion of the problem, which educates the team.
- Prioritizes further analysis and helps you take corrective action.
C) Results immediately discovered using Fishbone
- No process in place to ensure that every lift in the building always has a working battery.One battery for the lift on this unit is no longer working, and the other battery was being recharged.
- There is no process in place to ensure timely communication of new care information to the aides.New transfer information had not yet been conveyed to the aide. The aide’s “care card” still indicated transfer with the assist of one resident.
As a collaborative framework, the Fishbone Diagram elevates problem-solving efficiency, team engagement, and skill-building opportunities. Lean Advisors Inc.’s training programs on implementing the Fishbone Diagram have propelled many organizations towards embracing this robust problem-solving technique.
For further details about employing the Lean Fishbone Diagram and its potential advantages for your company, please contact Julia Novik, CEO of Lean Advisors Inc., at [email protected].


